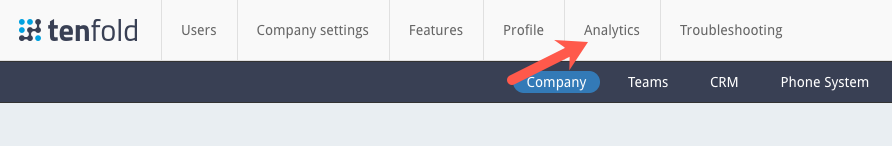
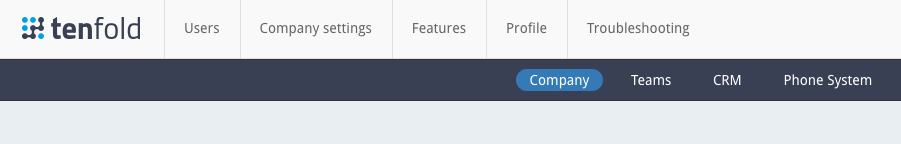
Use Analytics to understand customer interactions
Tenfold Analytics provides in-depth data about your customer interactions. Use the Company, Teams, User, and You tabs to zero in on the user analytics you're interested in reviewing.
Key features
- Date/time presets and calendar picker select the timeframe to view in the dashboard
- Quality Connect Rate line helps you maximize the efficiency of your outbound team
- Gamification highlights top performers in four different categories
- User Table gives you a quick review of stats
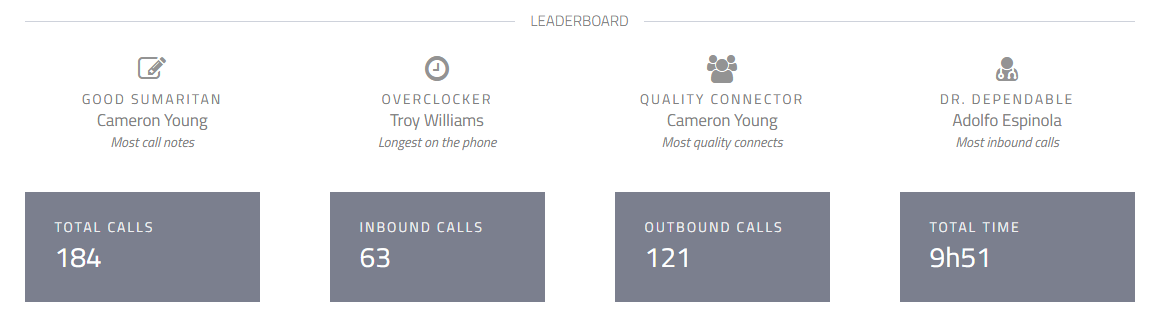
Leaderboard
Giving your top performers visibility is important and the Tenfold Analytics Dashboard allows you to do just that! Our Leaderboard highlights top performers by category:
- Good Samaritan: The user who took the most call notes within a specified time range
- Overclocker: The user who spent the longest amount of time spent on the phone within a specified time range
- Quality Connector: The user who had the most quality connects (see our Configure Analytics guide for more details)
- Dr. Dependable: The user who fielded the most inbound calls within a specified time range
Calls Graph
The Calls Graph can display several arrays of information. The two primary graphs include “Number of calls” and “Talk time” with multiple views for each, as shown below.
Both inbound calls (blue) and outbound (green) calls display by default. You can hide one or both call directions by tapping the icons below the call graph, helping you to focus on the activity you care about the most. You can also select a user from the User table, or the list above and to the left of your call graph, to view individual call activity.
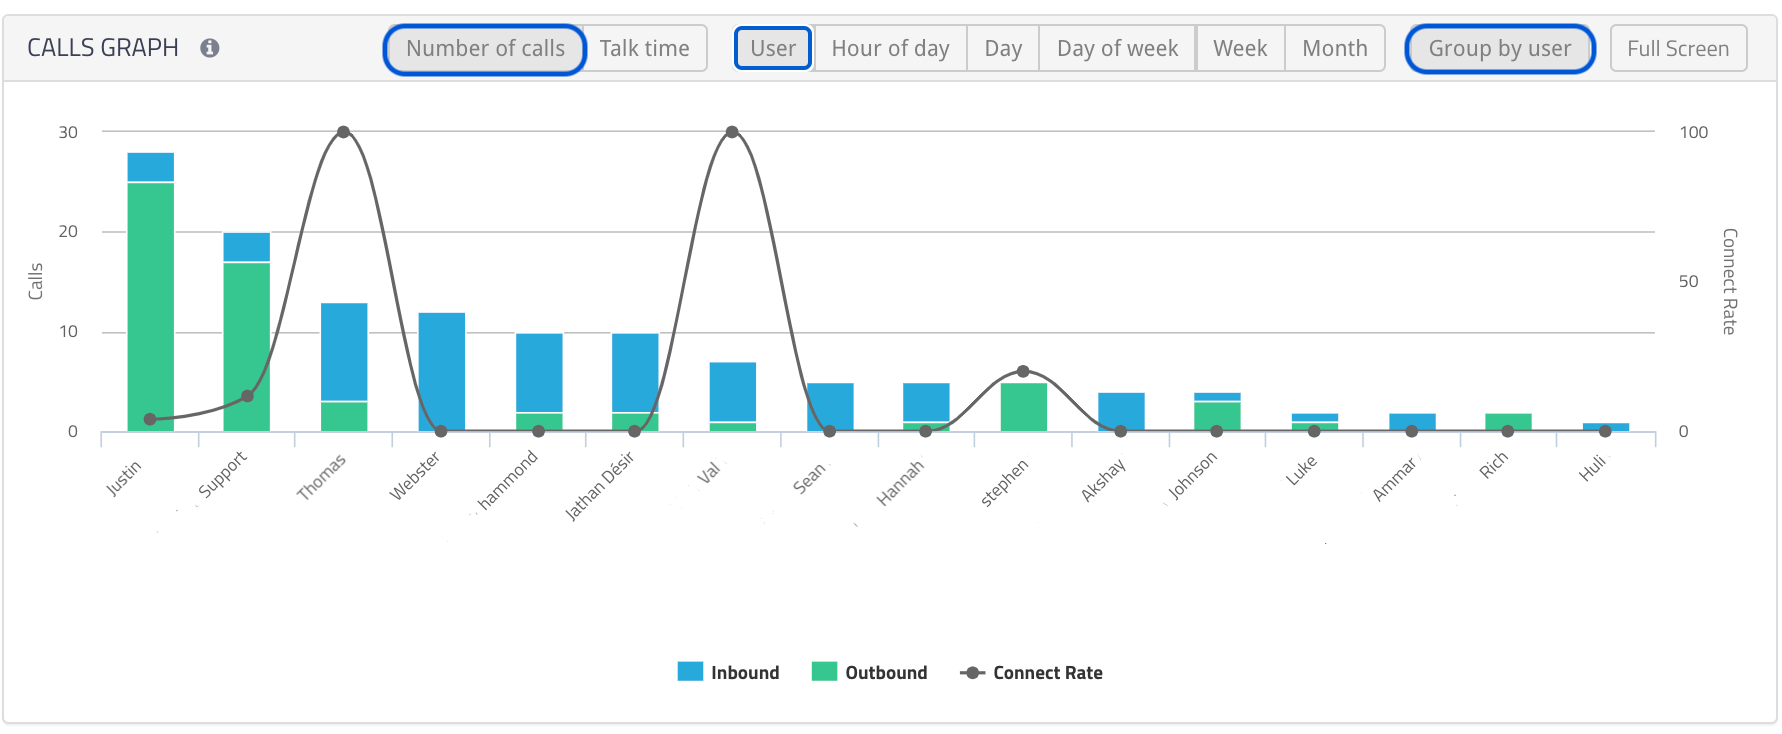
If you are interested in understanding which users are handling the majority of the call volume, or are spending the most time on the phones, explore Grouping by User and select User + Talk Time or User + Number of Calls.
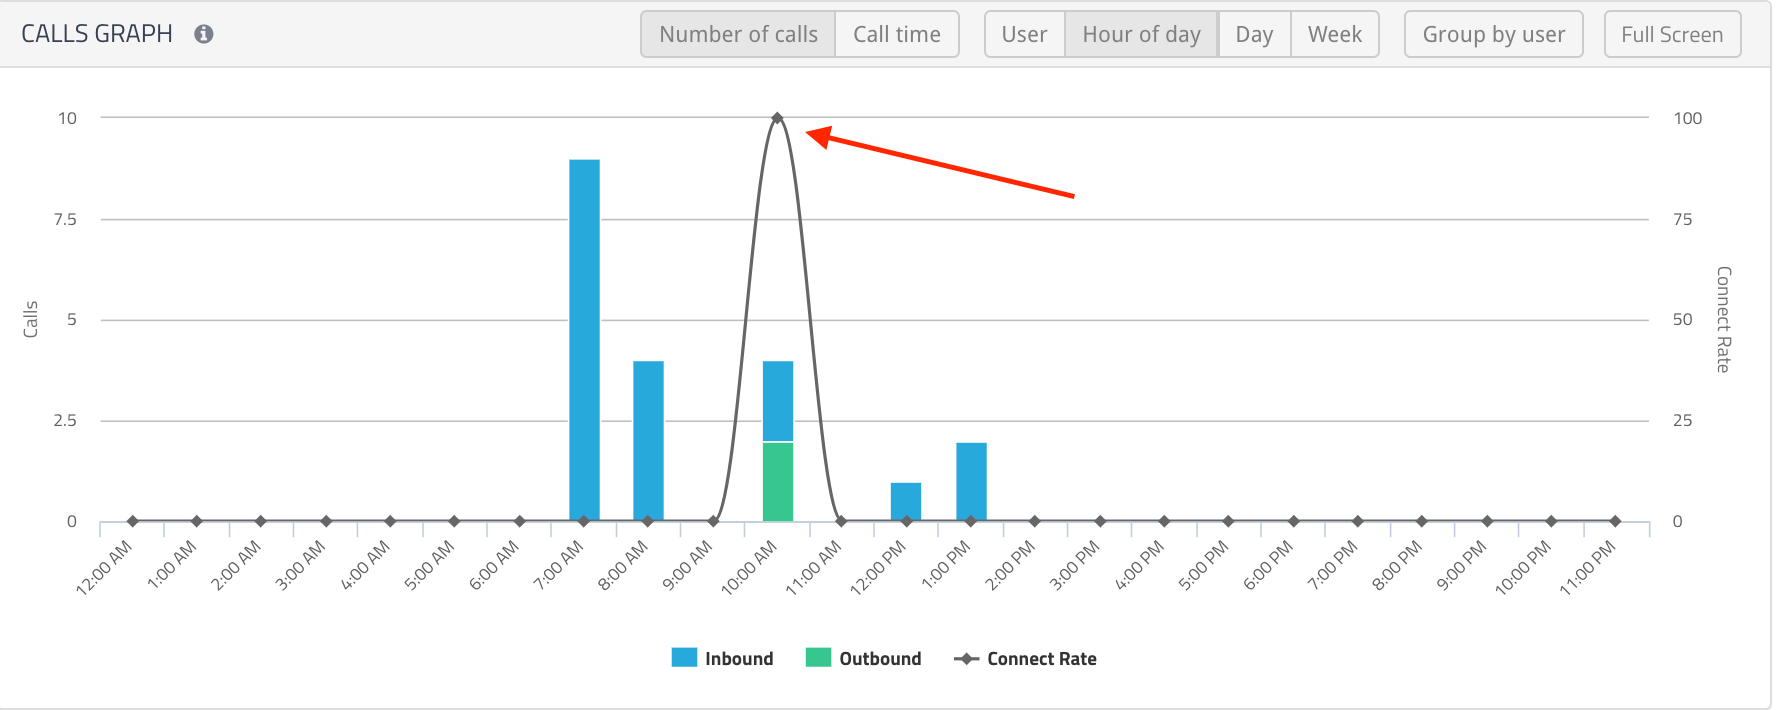
The bold black trend line which undulates across the graph represents your Quality Connect Rate. The Quality Connect Rate trend line helps users forecast when they will be most effective in outbound call attempts.
Pro Tip: Use the date and time picker in the top right corner to look at 1 month or more worth of analytics and identify your peaks and valleys. We encourage users with an outbound focus to schedule their call blocks during times they have historically been successful in connecting with their customers (peaks) and avoid spending time and effort reaching out to customers during spans of time which are characterized by a valley in the trend line.
User Table overview
The User Table displays detailed statistics for Inbound and Outbound calls for each member of a Team or the entire Company. Clicking Export emails you the table in a .CSV format, which you can open in any spreadsheet application.
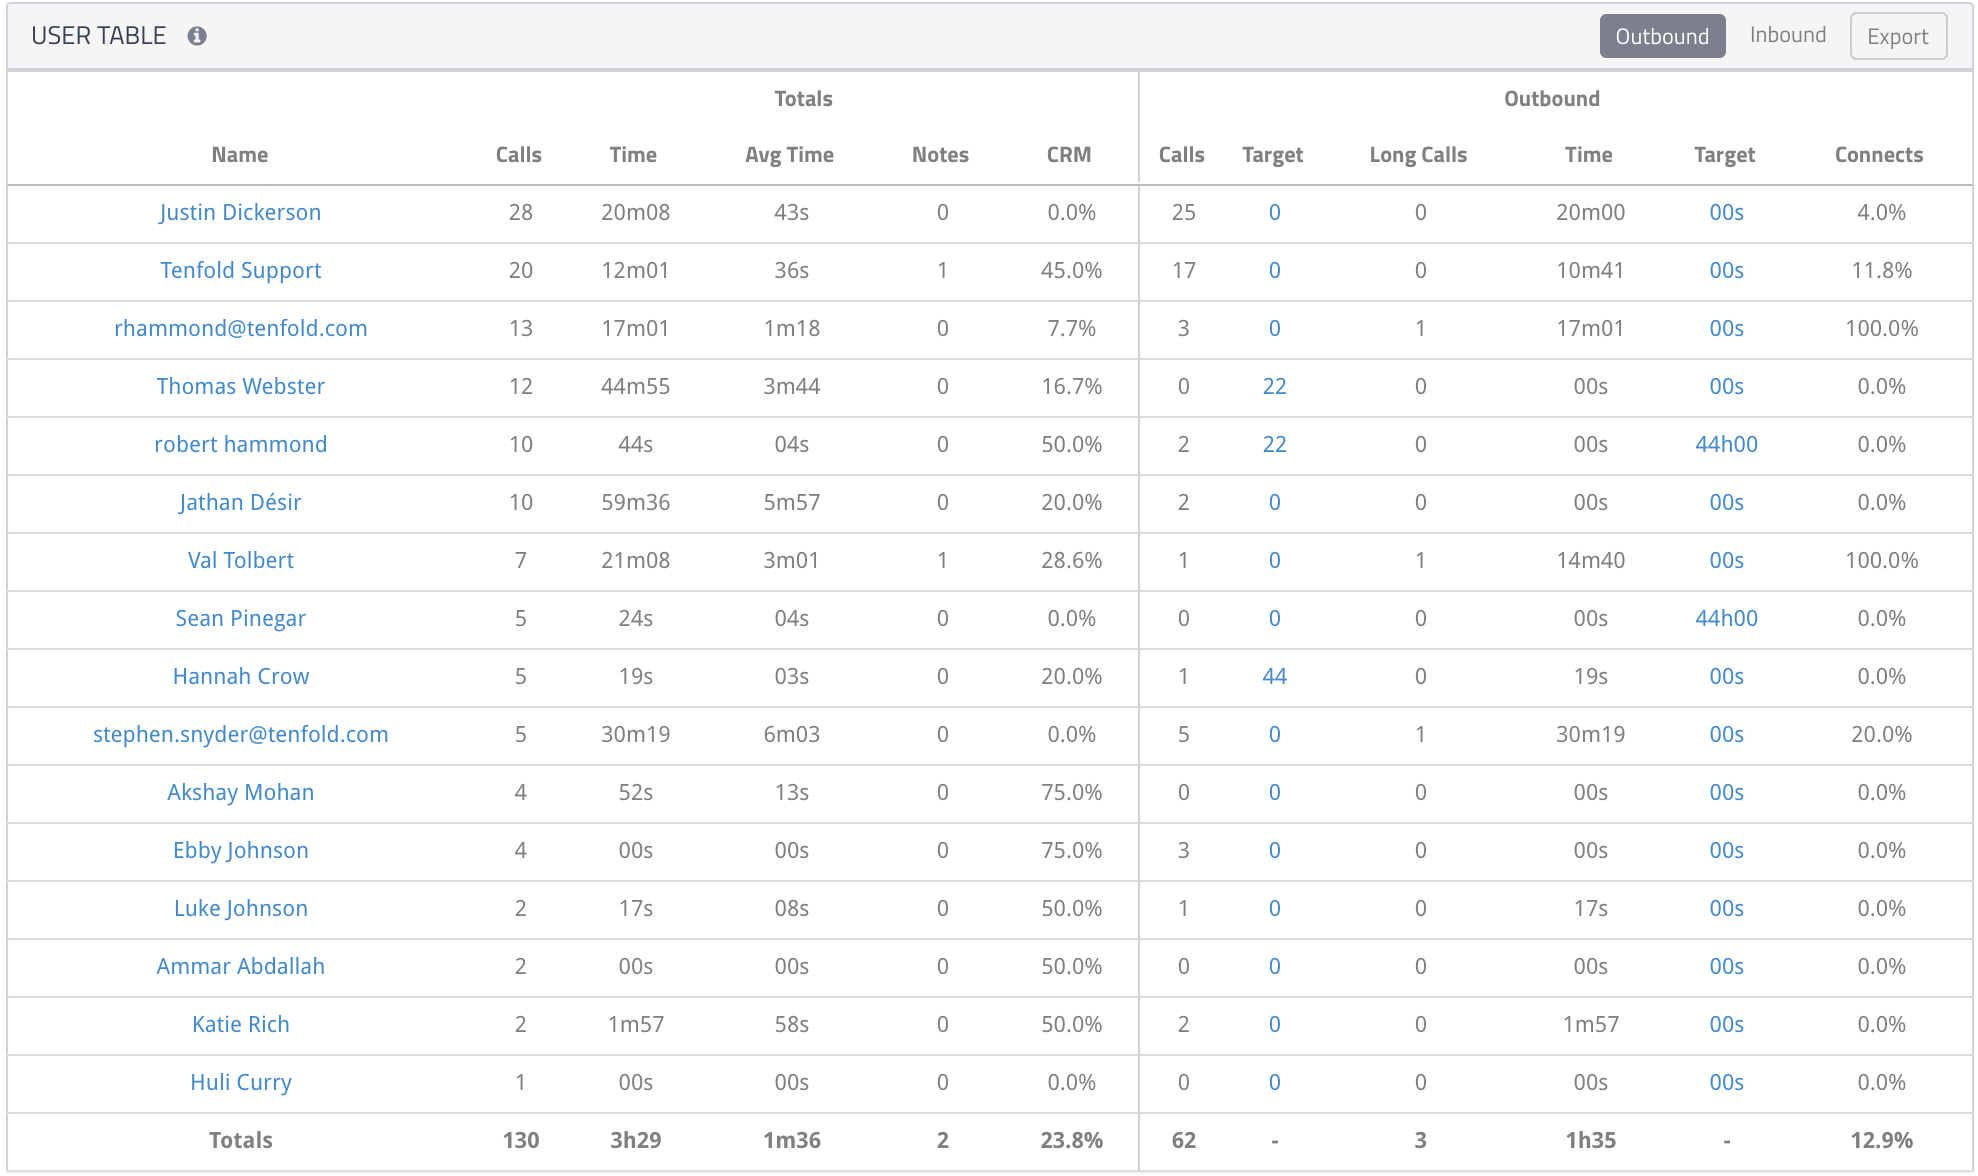
User Table statistics
Name: The name of the user associated with the in line call stats. Each name is hyperlinked so that you can click the name of a user to access their individual call analytics and notes.
Calls: The total number of calls associated to this Tenfold user, broken down into Inbound and Outbound calls. If the users are part of a Call Queue, this total may include these calls even if this user does not answer the phone. This varies depending on your organization’s phone system.
Time: The total amount of time spent on calls.
Avg Time: The average amount of time spent on a call. Look out for outliers, which can help you identify coaching opportunities.
Notes: Total number of calls where the Tenfold user entered notes using the Tenfold UI. Click the name of the user to read that user's notes.
CRM %: A CRM match occurs when the call phone number exists in the CRM at the time the call is placed or received. If the record is added during the call, this does not count as a CRM match. However, any subsequent calls to or from this phone number are counted. Where CRM % is concerned, the greater this number is, the better! We encourage users to aim for 90%.
Target: Enables you to set a Target call number and Target talk time to see how users measure up against that Target.
Long Calls: The Long Call threshold can be configured for the entire organization under Company Settings. Before selecting a threshold, use Tenfold for a few days or weeks to better understand what an unusually long call looks like for your team.
Connect %: The percentage of calls resulting in a Connected Event. Outbound calls with a duration greater than 1.5 minutes are considered Connected Events and directly impact the bold black trend line in your Call Graph. You can modify the threshold for a “Connect” in the Admin Dashboard.
Answered: This represents the number of inbound calls that were actually answered by users. Although Tenfold does not track missed calls, it is easy for users to identify whether or not they have missed calls by referencing this stat.
Detailed User Call History
Clicking a user's name displays call statistics and an in-depth Call History for that user.
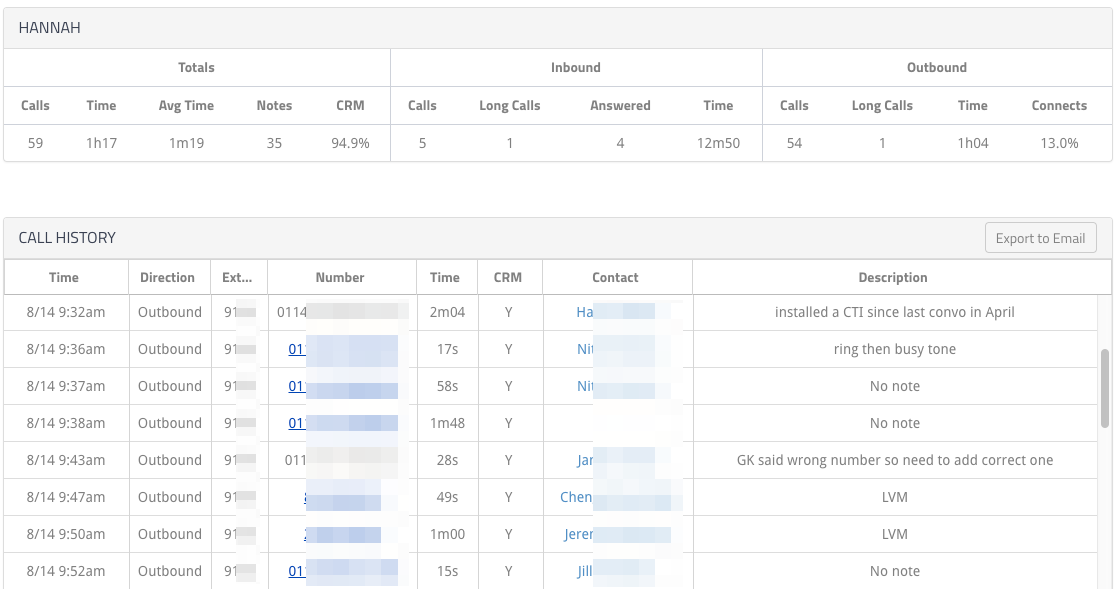
Stats
Stats are further broken down into interactive graphs. Hover over the graphs to view a snapshot of information. For example, if you are trying to understand the Industry your team spends the most of their time talking to, check out the last pie chart for quick insights.
Still have questions about Analytics? Contact your Customer Success Manager or our Support Team, or check out some of our other articles, like Create a Tenfold Reporting Dashboard inside Salesforce.com (SFDC).
Disable Analytics
To disable the Analytics feature:
- In Tenfold Dashboard, click Features at the top of the page and then click Analytics in the left-hand navigation links.
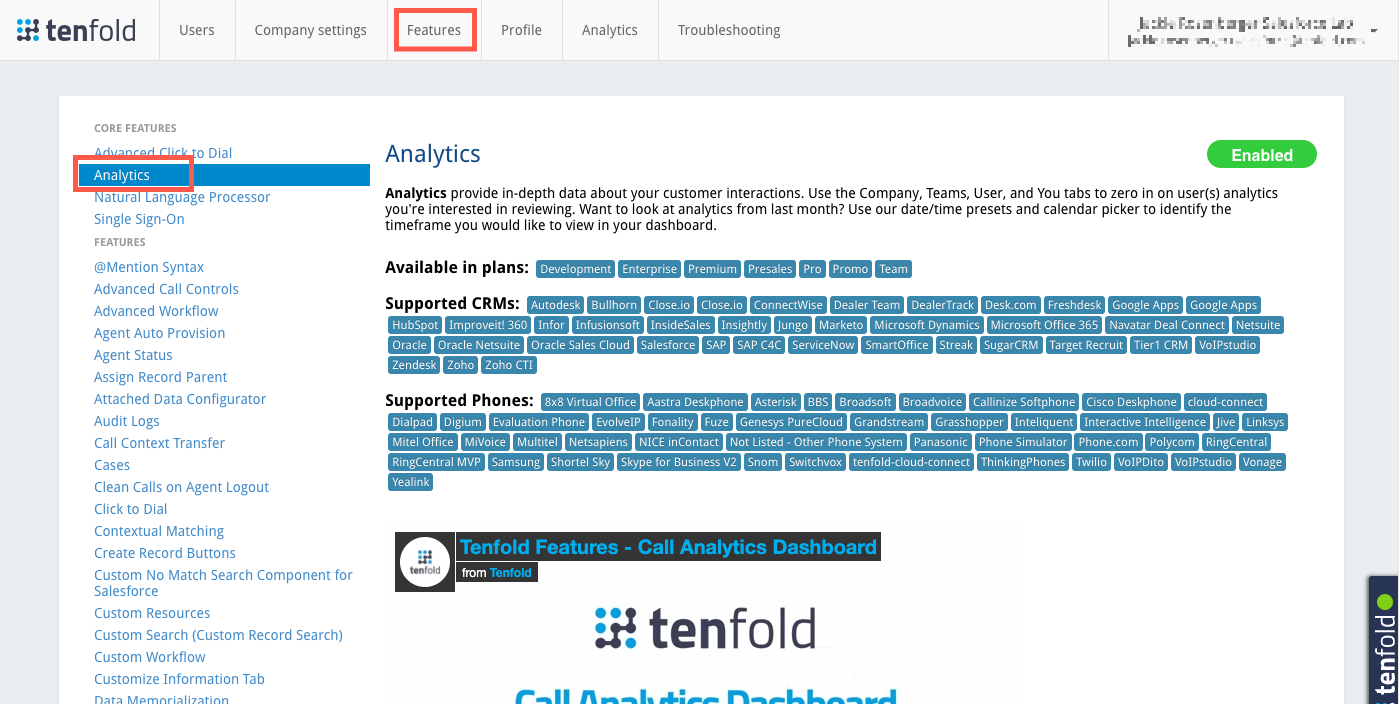
- Click the red "Enabled" pill button at the top right of the page so it turns red and displays "Disabled."
- Refresh the Dashboard page, and the Analytics tab is removed.